The term 'digital divide' describes the fact that the world can be divided into people who do and people who don't have access to - and the capability to use - modern information technology, such as the telephone, television, or the Internet. The digital divide exists between those in cities and those in rural areas. For example, a 1999 study showed that 86% of Internet delivery was to the 20 largest cities. The digital divide also exists between the educated and the uneducated, between economic classes, and, globally, between the more and less industrially developed nations.

The term 'digital divide' describes the fact that the world can be divided into people who do and people who don't have access to - and the capability to use - modern information technology, such as the telephone, television, or the Internet. The digital divide exists between those in cities and those in rural areas. For example, a 1999 study showed that 86% of Internet delivery was to the 20 largest cities. The digital divide also exists between the educated and the uneducated, between economic classes, and, globally, between the more and less industrially developed nations.
Forums
Forums are online discussion boards that allow people to interact and post in topics of interest. They can be maintained in professional or personal styles, with many forums mixing both styles seamlessly.
Each course within Blackboard has discussion boards, which you may find useful to use with your students and as a way to record collaborative discussion and work.

Blogs
A blog is effectively an online journal, allowing you to create entries as often or as little as you like. The added benefit over some traditional methods is that rich content such as images, audio and video can all be embedded into blog posts.
Blogs are also good for both reflective and informative writing. Some people use them to keep people informed on updates i.e. upcoming sessions and links to other interesting material that may support students. Others, particularly students, find blogs useful as reflective tools as they can record all their thoughts and feelings relating to their studies. They are also a good way for students to record supporting evidence they find online which might otherwise be read and then forgotten about with no record of it being used.
Blogs are also good for both reflective and informative writing. Some people use them to keep people informed on updates i.e. upcoming sessions and links to other interesting material that may support students. Others, particularly students, find blogs useful as reflective tools as they can record all their thoughts and feelings relating to their studies. They are also a good way for students to record supporting evidence they find online which might otherwise be read and then forgotten about with no record of it being used.

Wikis
A 'wiki' is a piece of software, usually operating openly on the Internet, which allows users to create, edit and maintain pages. The biggest example, and one which you may well have used yourself, is Wikipedia, a free, online encyclopaedia which runs though a wiki.
You can set up dedicated wikis for your area quickly and easily using some free online tools. Another way to try using a wiki is as a place where work is created and recorded during group tasks.
Free, online wikis you might want to try include:

Routers
Routers route data around the network from data senders to receivers. A router is able to determine the destination address for the data and determines the best way for the data to continue its journey. Unlike bridges and switches, which use the hardware-configured MAC address to determine the destination of the data, routers use the logic network address such as IP address to make decisions.
Routers route data around the network from data senders to receivers. A router is able to determine the destination address for the data and determines the best way for the data to continue its journey. Unlike bridges and switches, which use the hardware-configured MAC address to determine the destination of the data, routers use the logic network address such as IP address to make decisions.

Switches
Switches control the flow of network traffic based on the address information in each packet. A switch learns which devices are connected to its ports (by monitoring the packets it receives), and then forwards on packets to the appropriate port only. This allows simultaneous communication across the switch, improving bandwidth.This switching operation reduces the amount of unnecessary traffic that would have occurred if the same information had been sent from every port (as with a hub).Switches and hubs are often used in the same network; the hubs extend the network by providing more ports, and the switches divide the network into smaller, less congested sections.

HubsThe term ‘hub’ is sometimes used to refer to any piece of network equipment that connects PCs together, but it actually refers to a multi-port repeater. This type of device simply passes on (repeats) all the information it receives, so that all devices connected to its ports receive that information.Hubs repeat everything they receive and can be used to extend the network. However, this can result in a lot of unnecessary traffic being sent to all devices on the network. Hubs pass on traffic to the network regardless of the intended destination; the PCs to which the packets are sent use the address information in each packet to work out which packets are meant for them. In a small network repeating is not a problem but for a larger, more heavily used network, another piece of networking equipment (such as a switch) may be required to help reduce the amount of unnecessary traffic being generated.
Saturday, February 25, 2012
Digital Divide
digital divide
The term 'digital divide' describes the fact that the world can be divided into people who do and people who don't have access to - and the capability to use - modern information technology, such as the telephone, television, or the Internet. The digital divide exists between those in cities and those in rural areas. For example, a 1999 study showed that 86% of Internet delivery was to the 20 largest cities. The digital divide also exists between the educated and the uneducated, between economic classes, and, globally, between the more and less industrially developed nations.
The term 'digital divide' describes the fact that the world can be divided into people who do and people who don't have access to - and the capability to use - modern information technology, such as the telephone, television, or the Internet. The digital divide exists between those in cities and those in rural areas. For example, a 1999 study showed that 86% of Internet delivery was to the 20 largest cities. The digital divide also exists between the educated and the uneducated, between economic classes, and, globally, between the more and less industrially developed nations.
Saturday, December 3, 2011
Market Research Applications and Tools!!
We provide pricing strategy consulting backed by strong pricing research capabilities. Our perspective is broad when dealing with pricing research and pricing strategy decisions, and focus on finding for your business optimum price-product-feature configurations in the context of market positioning opportunities. We employ both qualitative and quantitative pricing research tools.
Product market research serves several goals: new product design and market validation research, or assessing existing product strength and line extension potential. We follow the product development cycle integrating research with creative positioning and technical product design efforts.
Product market research serves several goals: new product design and market validation research, or assessing existing product strength and line extension potential. We follow the product development cycle integrating research with creative positioning and technical product design efforts.
What is Market Research?!
- Market Research is getting information about consumers by studying statistics and reports and gathering new data by surveys of individual or groups.
Saturday, November 12, 2011
ADVANTAGES AND DISADVANTAGES OF SIMULATION:
WHAT IS SIMULATION?
Computer simulation is the discipline of designing a model of an actual or theoretical physical system, executing the model on a digital computer, and analyzing the execution output. Simulation embodies the principle of ``learning by doing'' --- to learn about the system we must first build a model of some sort and then operate the model. The use of simulation is an activity that is as natural as a child who role plays. Children understand the world around them by simulating (with toys and figurines) most of their interactions with other people, animals and objects. As adults, we lose some of this childlike behavior but recapture it later on through computer simulation. To understand reality and all of its complexity, we must build artificial objects and dynamically act out roles with them. Computer simulation is the electronic equivalent of this type of role playing and it serves to drive synthetic environments and virtual worlds. Within the overall task of simulation, there are three primary sub-fields: model design, model execution and model analysis (see Fig. 1). The chapter annotations in Fig. 1 relate to the author's recent simulation textbook (see the section READ MORE ABOUT IT) which focuses on the first two sub-fields. Figure 1: Three Sub-Fields of Computer Simulation.To simulate something physical, you will first need to create a mathematical model which represents that physical object. Models can take many forms including declarative, functional, constraint, spatial or multimodel. A multimodel is a model containing multiple integrated models each of which represents a level of granularity for the physical system. The next task, once a model has been developed, is to execute the model on a computer --- that is, you need to create a computer program which steps through time while updating the state and event variables in your mathematical model. There are many ways to ``step through time.'' You can, for instance, leap through time using event scheduling or you can employ small time increments using time slicing. You can also execute (i.e., simulate) the program on a massively parallel computer. This is called parallel and distributed simulation. For many large-scale models, this is the only feasible way of getting answers back in a reasonable amount of time.Simulation of a system can be done at many different levels of fidelity so that whereas one reader will think of physics-based models and output, another may think of more abstract models which yield higher-level, less detailed output as in a queuing network. Models are designed to provide answers at a given abstraction level --- the more detailed the model, the more detailed the output. The kind of output you need will suggest the type of model you will employ. An example of graphical output from a physically-based model (generated using the program AERO
Monday, October 24, 2011
Applications For Monitoring System
Applications For Monitoring System:
1- Weather Monitoring
2- Climate Monitoring
3- Medical Monitoring
4- Environment Monitoring
Saturday, October 22, 2011
Monitoring the Environment
Environmental monitoring describes the processes and activities that need to take place to characterise and monitor the quality of the environment. Environmental monitoring is used in the preparation of environmental impact assessments, as well as in many circumstances in which human activities carry a risk of harmful effects on the natural environment. All monitoring strategies and programmes have reasons and justifications which are often designed to establish the current status of an environment or to establish trends in environmental parameters. In all cases the results of monitoring will be reviewed, analysed statistically and published. The design of a monitoring programme must therefore have regard to the final use of the data before monitoring starts.
Design of environmental monitoring programmes
Monitoring is of little use without a clear and unambiguous definition of the reasons for the monitoring and the objectives that it will satisfy. Almost all monitoring (except perhaps remote sensing) is in some part invasive of the environment under study and extensive and poorly planned monitoring carries a risk of damage to the environment. This may be a critical consideration in wilderness areas or when monitoring very rare organisms or those that are averse to human presence. Some monitoring techniques, such a gill netting fish to estimate populations, can be very damaging, at least to the local population and can also degrade public trust in scientists carrying out the monitoring.
Almost all mainstream environmentalism monitoring projects form part of an overall monitoring strategy or research field, and these field and strategies are themselves derived from the high levels objectives or aspirations of an organisation. Unless individual monitoring projects fit into a wider strategic framework, the results are unlikely to be published and the environmental understanding produced by the monitoring will be lost.

Saturday, October 1, 2011
Design
In systems design the design functions and operations are described in detail, including screen layouts, business rules, process diagrams and other documentation. The output of this stage will describe the new system as a collection of modules or subsystems.
The design stage takes as its initial input the requirements identified in the approved requirements document. For each requirement, a set of one or more design elements will be produced as a result of interviews, workshops, and/or prototype efforts.Design elements describe the desired software features in detail, and generally include functional hierarchy diagrams, screen layout diagrams, tables of business rules, business process diagrams, pseudocode, and a complete entity-relationship diagram with a full data dictionary. These design elements are intended to describe the software in sufficient detail that skilled programmers may develop the software with minimal additional input design.
Sunday, September 25, 2011
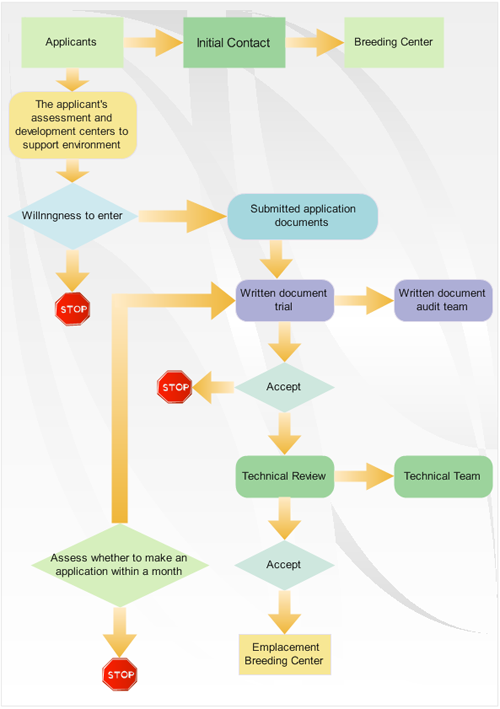
Flowchart
A flowchart is a type of diagram that represents an algorithm or process, showing the steps as boxes of various kinds, and their order by connecting these with arrows. This diagrammatic representation can give a step-by-step solution to a given problem. Process operations are represented in these boxes, and arrows connecting them represent flow of control. Data flows are not typically represented in a flowchart, in contrast with data flow diagrams; rather, they are implied by the sequencing of operations. Flowcharts are used in analyzing, designing, documenting or managing a process or program in various fields.

Process flow diagram
Process flow diagram
A process flow diagram (PFD) is a diagram commonly used in engineering to indicate the general flow of plant processes and equipment. The PFD displays the relationship between major equipment of a plant facility and does not show minor details such as piping details and designations. Another commonly-used term for a PFD is a flowsheet.
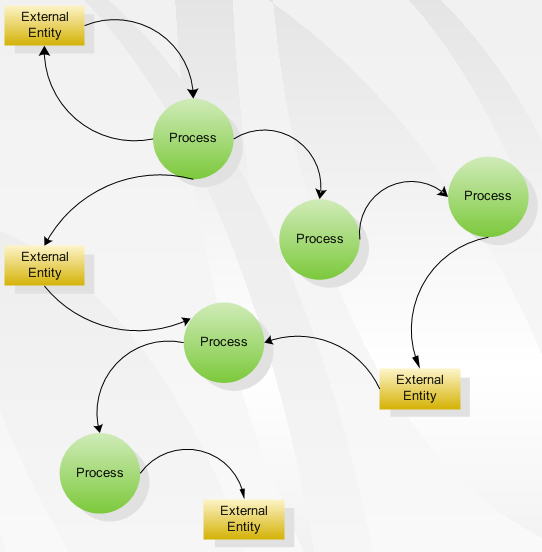
Data flow diagram
Data flow diagram
Is a graphical representation of the "flow" of data through an information system, modelling its process aspects. Often they are a preliminary step used to create an overview of the system which can later be elaborated.DFDs can also be used for the visualization of data processing (structured design).
Saturday, September 24, 2011


Systems Analysis Definition :
(SAD) The analysis of the role of a proposed system and the identification of the requirements that it should meet. SAD is the starting point for system design. The term is most commonly used in the context of commercial programming, where software developers are often classed as either systems analysts or programmers. The systems analysts are responsible for identifying requirements (i.e. systems analysis) and producing a design. The programmers are then responsible for implementing it.
Saturday, September 17, 2011
what is meant by system analyst ?
A system analyst is the person who selects and configures computer systems for an organization or business. His or her job typically begins with determining the intended purpose of the computers. This means the analyst must understand the general objectives of the business, as well as what each individual user's job requires. Once the system analyst has determined the general and specific needs of the business, he can choose appropriate systems that will help accomplish the goals of the business.